Simpli.fi’s CEO Frost Prioleau recently shared with us some of his views, and a new product entry, into understanding how geotargeted ad spend drives offline conversion. Simpli.fi’s new product Geo-Conversion Lift takes on the problem of showing how geotargeted mobile ad campaigns drive additional foot traffic that can be attributed to a campaign. Not any easy problem to solve but one that has a lot of ad spend and much more retail spend tied to it. Marketers are shifting more spend into mobile, and in particular location-targeted mobile. We’ve seen convincing data showing that location-targeting consistently drives higher conversions than non-location targeted ads. This encourages more spend. Indeed, BIA/Kelsey’s estimate is that location targeted mobile ad spend will soar to over $32 billion by 2021. As programmatic trading makes geotargeting more efficient and data-driven audience targeting more effective, more national brands are moving into location-targeted spending. Prioleau agrees saying that Simpli.fi is seeing significant account and spending growth from national marketers.
Marketers need to get some additional visibility into how campaigns are performing and have the ability to do optimizations based on those insights. The media industry’s responded by offering geo-targeting, geo-fencing, and geo-conquesting products to name a few. And other companies offer various methodologies to show conversion, based on exposed/non-exposed samples during the campaign or before/after studies. With identify authentication and cross-device tagging, we’re seeing even more data available to marketers. This helps explain acquisitions such as SNAP’s pick-up of Placed to tie online campaigns to off-line purchasing.
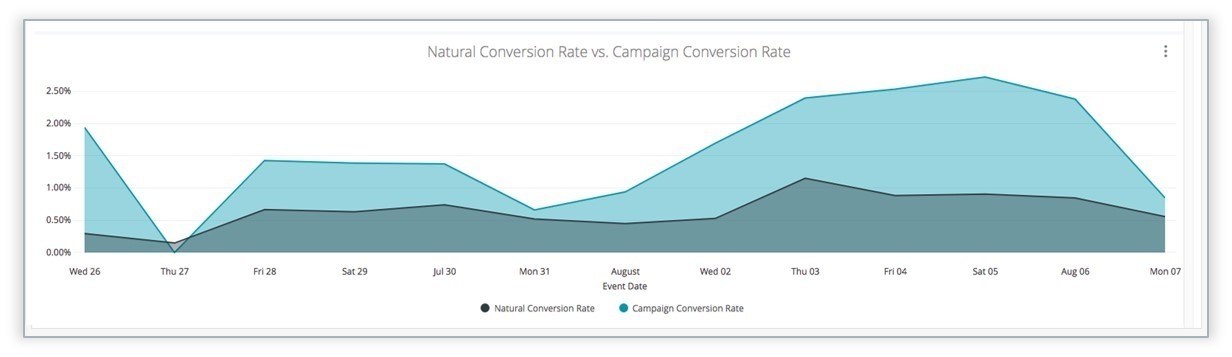
Frost’s view is that panel-based attribution approaches don’t work for location targeting because the data just aren’t granular enough. Simpli.fi’s approach is to compare a “natural conversion rate” that they compare to “geo-conversion lift” metric they create from data signals without using a “hold-out set” or formal experiment. He argues that since Simpli.fi analytics are based on as much as 60 times the data of panel-based systems, they can provide a much more granular look at local activations. Essentially, Simpli.fi developed a statistical methodology to compare new and repeat conversion rates that occur “naturally” (i.e., consumers not exposed to the campaign) versus the change they can attribute to campaign exposure.
The Geo-Conversion Lift dashboard Simpli.fi provides clients shows data and visualizations of the campaign’s conversion, i.e., foot traffic to a desired location by consumers. In the graphic we see some of the key metrics coming out of these analytics. So in the example below, we see that a campaign with the goal to drive consumers to a specific “conversion zone” or specific location drive a 145.99% Geo-Conversion Lift. The campaign was a success in driving higher lift for those visiting the target zone on the floor exposed to the ad versus not exposed.
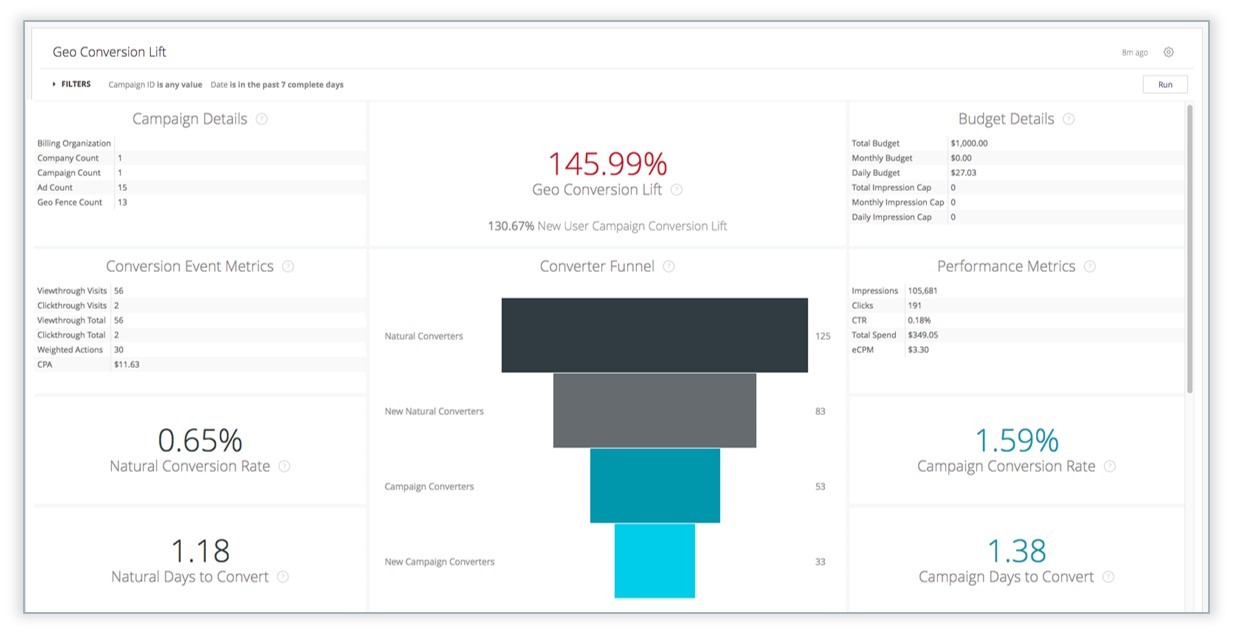
Here are the specific definitions Simpli.fi uses:
- Campaign Conversion Rate: The percentage of users who were detected in a target zone, were then served an ad, and then were detected in a conversion zone for the same campaign.
- Natural Conversion Rate: The percentage of users that have been detected in a target zone, not served an ad, and then detected in a conversion zone for the same campaign.
- Geo-Conversion Lift: Percentage difference in Campaign Conversion Rate vs. Natural Conversion Rate.
- New User Campaign Conversion Lift: The campaign conversion lift with repeat converters excluded.
- Natural Days to Convert: The average number of days it takes users, whether they’ve been served an ad or not, to go from a target zone to the conversion zone.
- Campaign Days to Convert: The average number of days it takes users who were served an ad to go from a target zone to the conversion zone.
At the end of the day, here’s the kind of data visualization marketers want to see to check off that yes, it was a successful campaign.